

by Shane M Grizzle | Updated on October 04, 2023
The previous blog started the ‘Build Bridges’ mini-series, underlining the critical link between stakeholder engagement and a cohesive customer experience. Ineffective stakeholder engagement could result in an inconsistent customer experience.
The ‘Build Bridges‘ mini-series will cover a few tools and techniques that help enhance stakeholder engagement. While seasoned professionals in this domain may find some content familiar, the mini-series serves as both a refresher and a reference for sharing with less experienced individuals in your network. All readers are encouraged to share their thoughts in the comments section of the blog.
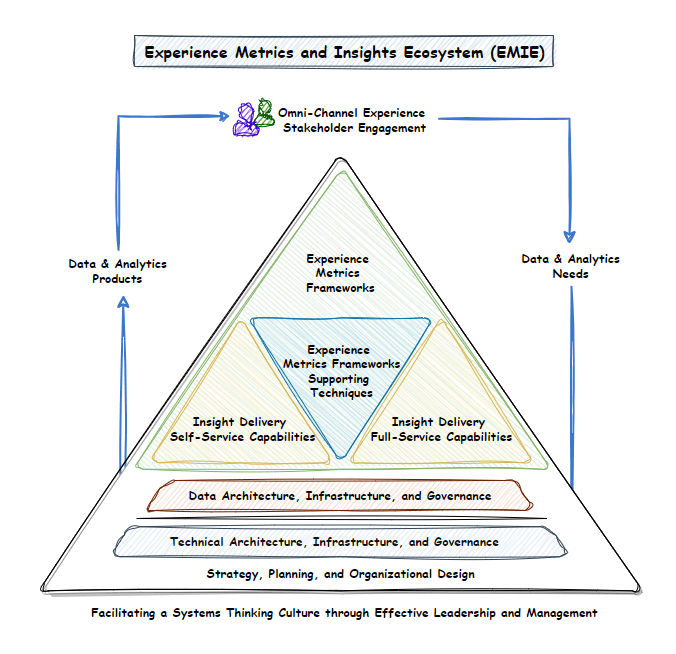
In this blog post, the focus shifts to context diagrams. For those versed in systems engineering, the mention of system context diagrams may ring a bell. However, what is explored here is its application beyond traditional engineering contexts—specifically, leveraging context diagrams for understanding omni-channel stakeholder engagement. This understanding is instrumental within the broader framework of the Experience Metrics and Insights Ecosystem (EMIE).
Situation
Whether dealing with organizational change or steering a new department or team, understanding tools that can quickly help map connections with stakeholders becomes valuable, which is where the context diagram comes into play. Within large organizations, it’s common for the landscape to undergo organizational shifts, altering structures and reshaping reporting lines and decision-making authority. For leaders at both the departmental and team levels, particularly those navigating the space of customer experience, wrestling with the aftermath of these changes can become a challenge. These challenges can impact stakeholder engagement.
Context Diagram
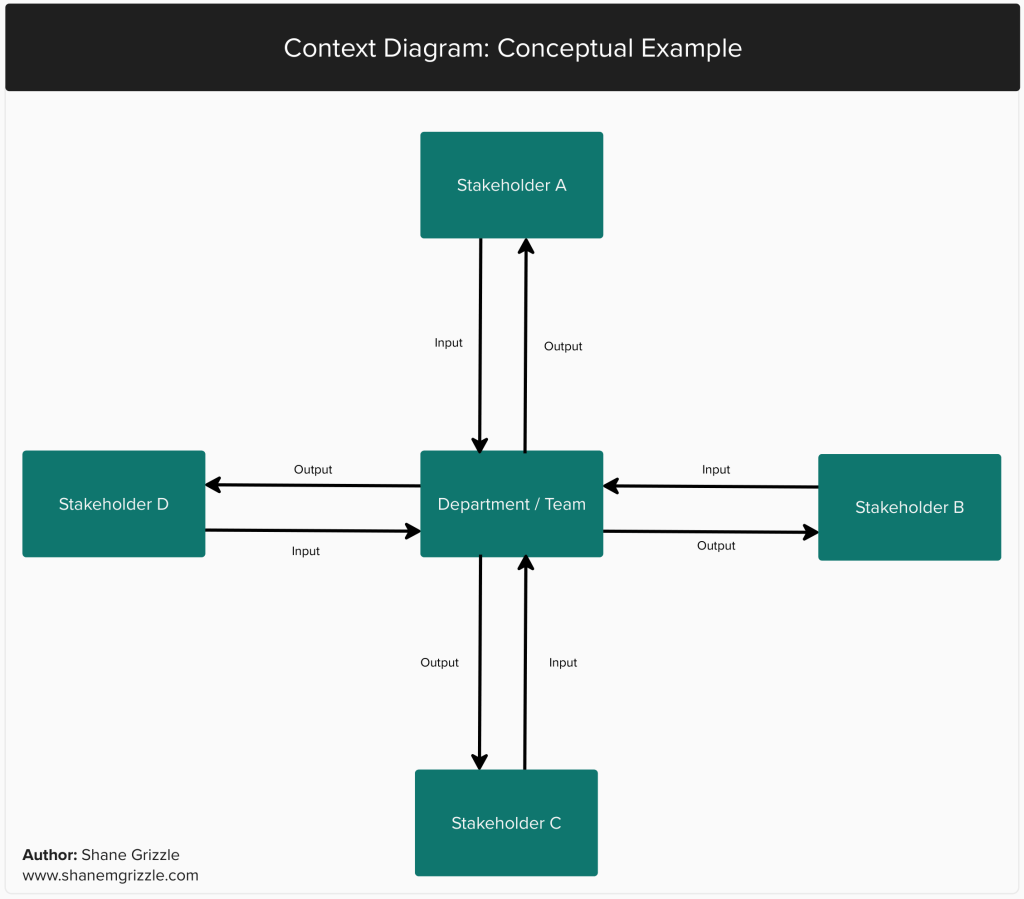
A context diagram serves as a straightforward visual representation of a system and its interactions with other entities. In the context of stakeholder engagement, the system refers to the team or department, while the other entities encompass crucial internal stakeholders (i.e., partners and customers) engaged by the team or department. Interactions are categorized simply as inputs or outputs—outputs being what the team or department provides to defined internal stakeholders, and inputs representing what the team or department receives from these internal stakeholders. Reference the diagram below for a conceptual example of a context diagram. Later in this blog, an illustrative example is provided.
Creating a Context Diagram
Creating a context diagram is straight forward, and you can likely complete one from start to finish in just a few hours depending on the complexity of your organizational structure. High-level guidance related to creating a context diagram is as follows:
Identify Internal Stakeholders:
- Begin by focusing on the team or department in scope. Identify all internal stakeholders critical to your work.
- Stakeholders should exist at the same altitude as the targeted “system.” For instance, if your diagram focuses on a team, your stakeholders should also be at the team level.
- Categorize stakeholders as customers, partners, or both, depending on the nature of your interactions.
- Input these stakeholders into the context diagram, utilizing color-coding for clear groupings.
Highlight Outputs to Stakeholders:
- At a high level, list all outputs your team or department provides to stakeholders.
- Example: If your team delivers automated dashboards, consider this an output to your customers.
- Summarize these outputs and position them within the context diagram, aligned with arrows extending from the “system” to the respective stakeholder.
Highlight Inputs from Stakeholders:
- Finally, focus on the inputs the “system” receives from stakeholders.
- Example: Consider instances where your team receives business requirements, feedback, or input from another team. These inputs are crucial to understanding the dynamics of your ecosystem.
- Like the previous steps, represent these inputs on the diagram, aligning them with arrows extending from the respective stakeholder to the “system.”
The diagram below offers an illustrative example of a fully developed context diagram at the team level. Take a moment to familiarize yourself with the diagram. Are there noticeable opportunities for operational enhancement?
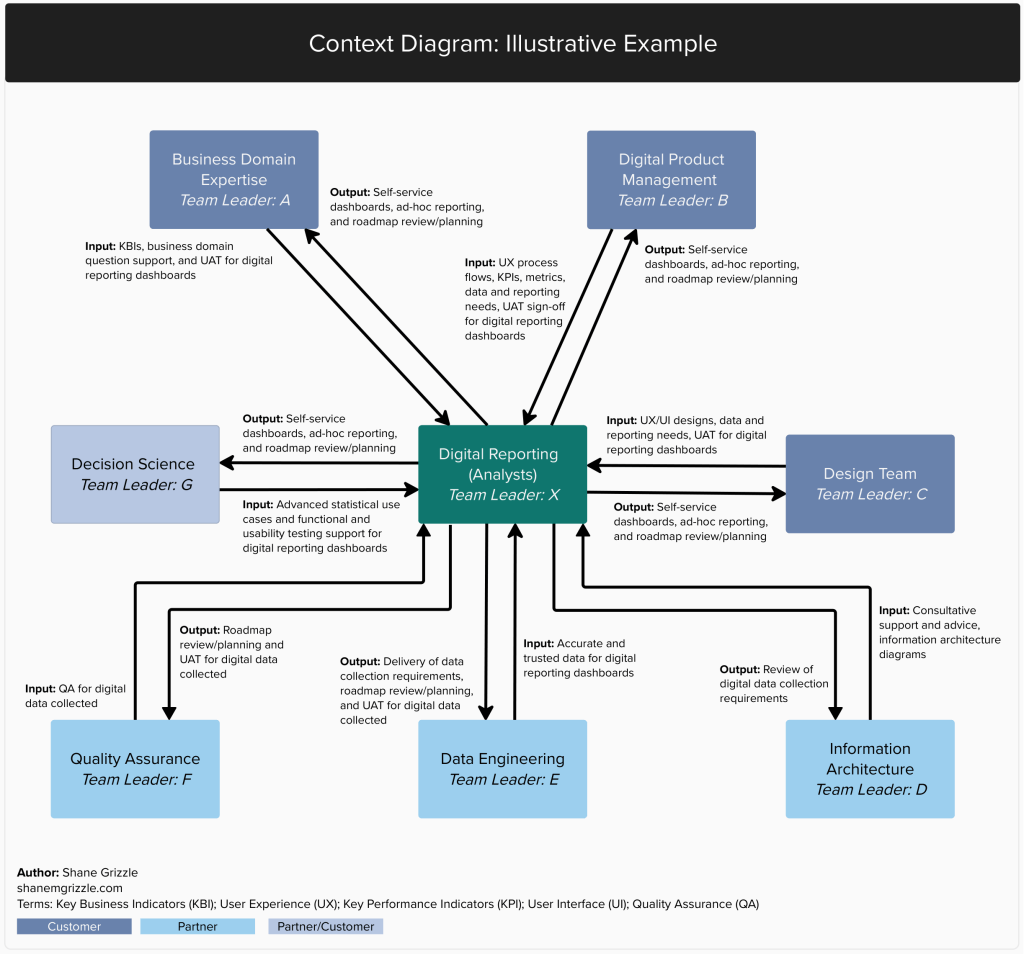
It’s important to recognize that, while a context diagram provides a high-level overview, it can help highlight areas requiring a more in-depth assessment. In this scenario, the Digital Reporting team engages with many stakeholders, a common occurrence in large organizations. However, a closer look reveals instances of redundancy. For example, the Quality Assurance (QA) team validates the work of the Data Engineering team, and the Reporting team collaborates with both for roadmap alignment.
The interactions with the QA and Data Engineering teams are necessary due to the subsequent acceptance testing conducted by the Digital Reporting team after QA activities. Delving deeper into these processes prompts the question: are there opportunities to streamline this engagement? A similar consideration arises in the Digital Reporting team’s requirements-gathering efforts.
By scrutinizing these interactions, potential efficiencies may become apparent, offering avenues for refining and optimizing the workflow. The context diagram serves as a valuable starting point for identifying such opportunities and guiding a more detailed evaluation of these collaborative processes.
Final Thoughts – Operational Efficiencies
Within the ‘Build Bridges’ mini-series, context diagrams are a tool that helps identify connections across stakeholders. These connections are essential for teams responsible for customer experience. If there is misalignment, then there is an increased likelihood of disjointed customer experiences. As organizations navigate changes in structures and reporting lines, leaders at departmental and team levels can often find themselves working through the challenges of sustaining effective stakeholder engagement.
The context diagram is a simple tool that leaders can leverage to unpack the complexities of stakeholder relationships. The benefits are straightforward, as context diagrams provide a visual snapshot that helps facilitate a comprehensive understanding of relationships and high-level deliverables. The simplicity of a context diagram makes it an excellent resource for onboarding new team members and assisting other areas to understand the stakeholder relationships that exist for a given “system.” Therefore, it’s a tool that helps builds bridges within an organization.
The ‘Build Bridges’ blog mini-series aims to showcase some techniques to help address challenges with stakeholder engagement. This blog was the second within the mini-series. Stay tuned for more content related to the ‘Build Bridges’ blog mini-series. In the meantime, please share techniques you’ve used to improve stakeholder engagement. Each organization differs, and I am interested in your perspective. You can share your experience within the Comments section.

Leave a comment