

by Shane M Grizzle | Updated on June 6, 2023
I often use the analogy of a house floor plan to illustrate the concept of Experience Metrics Frameworks. A house represents an overall experience that comprises various micro experiences and flows, such as the kitchen and hallways. A well-defined measurement framework (i.e., blueprint) influences the design of these micro experiences and flows. From laying the foundation to planning the interior design, a measurement framework ensures cohesive alignment of all activities that build the overarching experience we call “home.”
In essence, a home is a data-driven design. Similarly, customer experiences require a structured framework supporting diverse roles, from engineering processes to designing user interfaces. This need is precisely why Experience Metrics Frameworks are indispensable, as they provide a data-driven approach to crafting exceptional customer experiences.
Experience Metrics Frameworks encompasses the broader approach an organization leverages to measure, evaluate, and improve customer experiences. Examples of the frameworks include Google HEART and the Customer Experience (CX) Maturity Model. Additionally, frameworks like North Star and Objective and Key Result (OKR) can be effectively utilized within the realm of experience. There’s plenty of content available outside of this blog regarding these frameworks. It’s crucial to recognize that these frameworks provide guidance but may require adaptation in their implementation.
Experience Metrics Frameworks are supported by techniques that have significant value when applied in the appropriate contexts. Experience Metrics Frameworks Supporting Techniques are methodologies and tools used to measure, evaluate, and analyze various aspects of customer experiences. Examples of techniques include Customer Journey Mapping, Usability Testing, and Net Promoter Score. Again, there’s plenty of content outside of this blog about many of these techniques. However, this blog will focus on the technique of building what I call the “Experience Metrics Tree.”
Based on my experience, the Experience Metrics Tree has been instrumental in enhancing complex customer journeys and fostering alignment among internal stakeholders. This blog covers the significance of utilizing this technique to identify relationships and dependencies among different metrics and dimensions. Ultimately, this technique is a communication mechanism that supports the systematic evaluation of customer experiences, and in my past, has aligned closely with task success objectives. Note that task success is one component of the supporting framework, Google HEART.
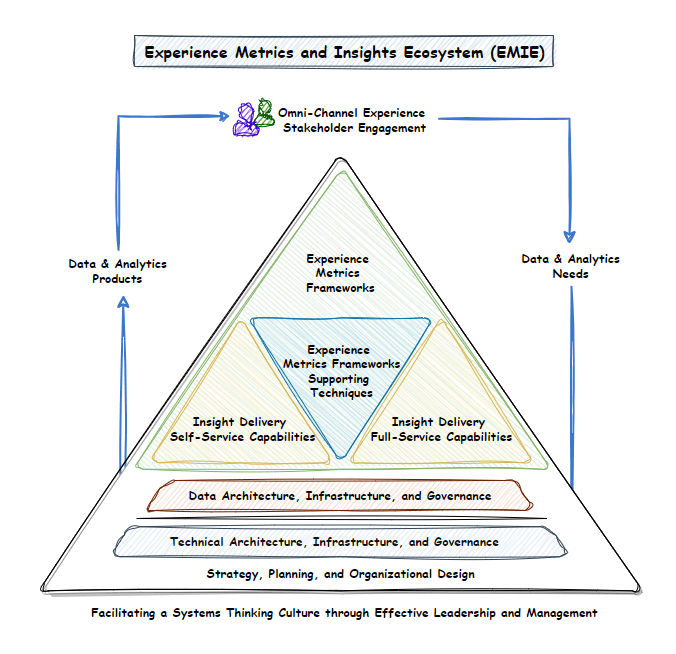
Reference the diagram below to conceptualize where Experience Metrics Frameworks and supporting techniques reside within the overarching Experience Metrics and Insights Ecosystem. Note that I will dive deeper into this visualization in a subsequent blog.
With 20 years of experience in the Insurance industry and a dedicated focus on enhancing customer experiences through data-driven approaches for 15 years, I have come to recognize the tremendous value of intentionally mapping experience metrics. Large insurers have dedicated teams comprising hundreds or even thousands of professionals who strive to improve complex workflows associated with acquiring new business, servicing customers, and processing claims. The technique of leveraging an Experience Metrics Tree has proven to be effective in aligning these activities.
Challenge
In the highly competitive business landscape, delivering exceptional customer experiences is paramount. However, in large organizations, the enhancement and optimization of customer experiences are influenced by hundreds, if not thousands, of individuals who often operate in groups independently. To achieve consistency in evaluating customer experiences’ success, aligning these individuals on a unified and holistic metrics framework is crucial. Rather than unaligned disparate efforts, a collective approach is required to provide a superior and seamless customer experience across all interactions.
Symptoms
- Inconsistent customer experiences exist within and across channels, impacting customer interactions and leading to customer confusion and reduced satisfaction
- Conflicting objectives, key performance indicators, and metrics across stakeholders leading to competing priorities that hinder creating a seamless customer experience.
- Lack of actionable insights due to reliance on isolated metrics and incomplete understanding of the customer journey.
- Difficulty in benchmarking customer experiences internally or across industries or competitors.
- Inefficient resource allocation resulting from misunderstandings of significant touchpoints and interactions, leading to misdirected investments and improvement opportunities.
- Fragmented data and insights limit end-to-end experience analysis across channels (e.g., mobile, phone, contact center).
Solution Consideration – Experience Metrics Tree
By developing an Experience Metrics Tree, organizations can encourage systems thinking and create a shared language and understanding of customer experience evaluation, fostering consistency and collaboration. Experience Metrics Trees serve as a powerful solution, providing a structured visualization that aligns people and activities, enabling organizations to foster collaboration and drive customer-centric improvements across the entire organization.
The Experience Metrics Tree technique identifies relationships and dependencies between different metrics and dimensions within the customer experience. By mapping out these connections, businesses gain a holistic view of the customer journey. They can also make data-driven decisions to enhance and optimize experiences. The Experience Metrics Tree supports aligning activities and stakeholders, harmonizing complex customer journeys. It provides a unified approach that goes beyond isolated metrics, enabling businesses to track and analyze the end-to-end customer experience, identify areas for improvement, and allocate resources effectively. Ultimately, the Experience Metrics Tree is a valuable tool for systematically evaluating and improving customer experiences.
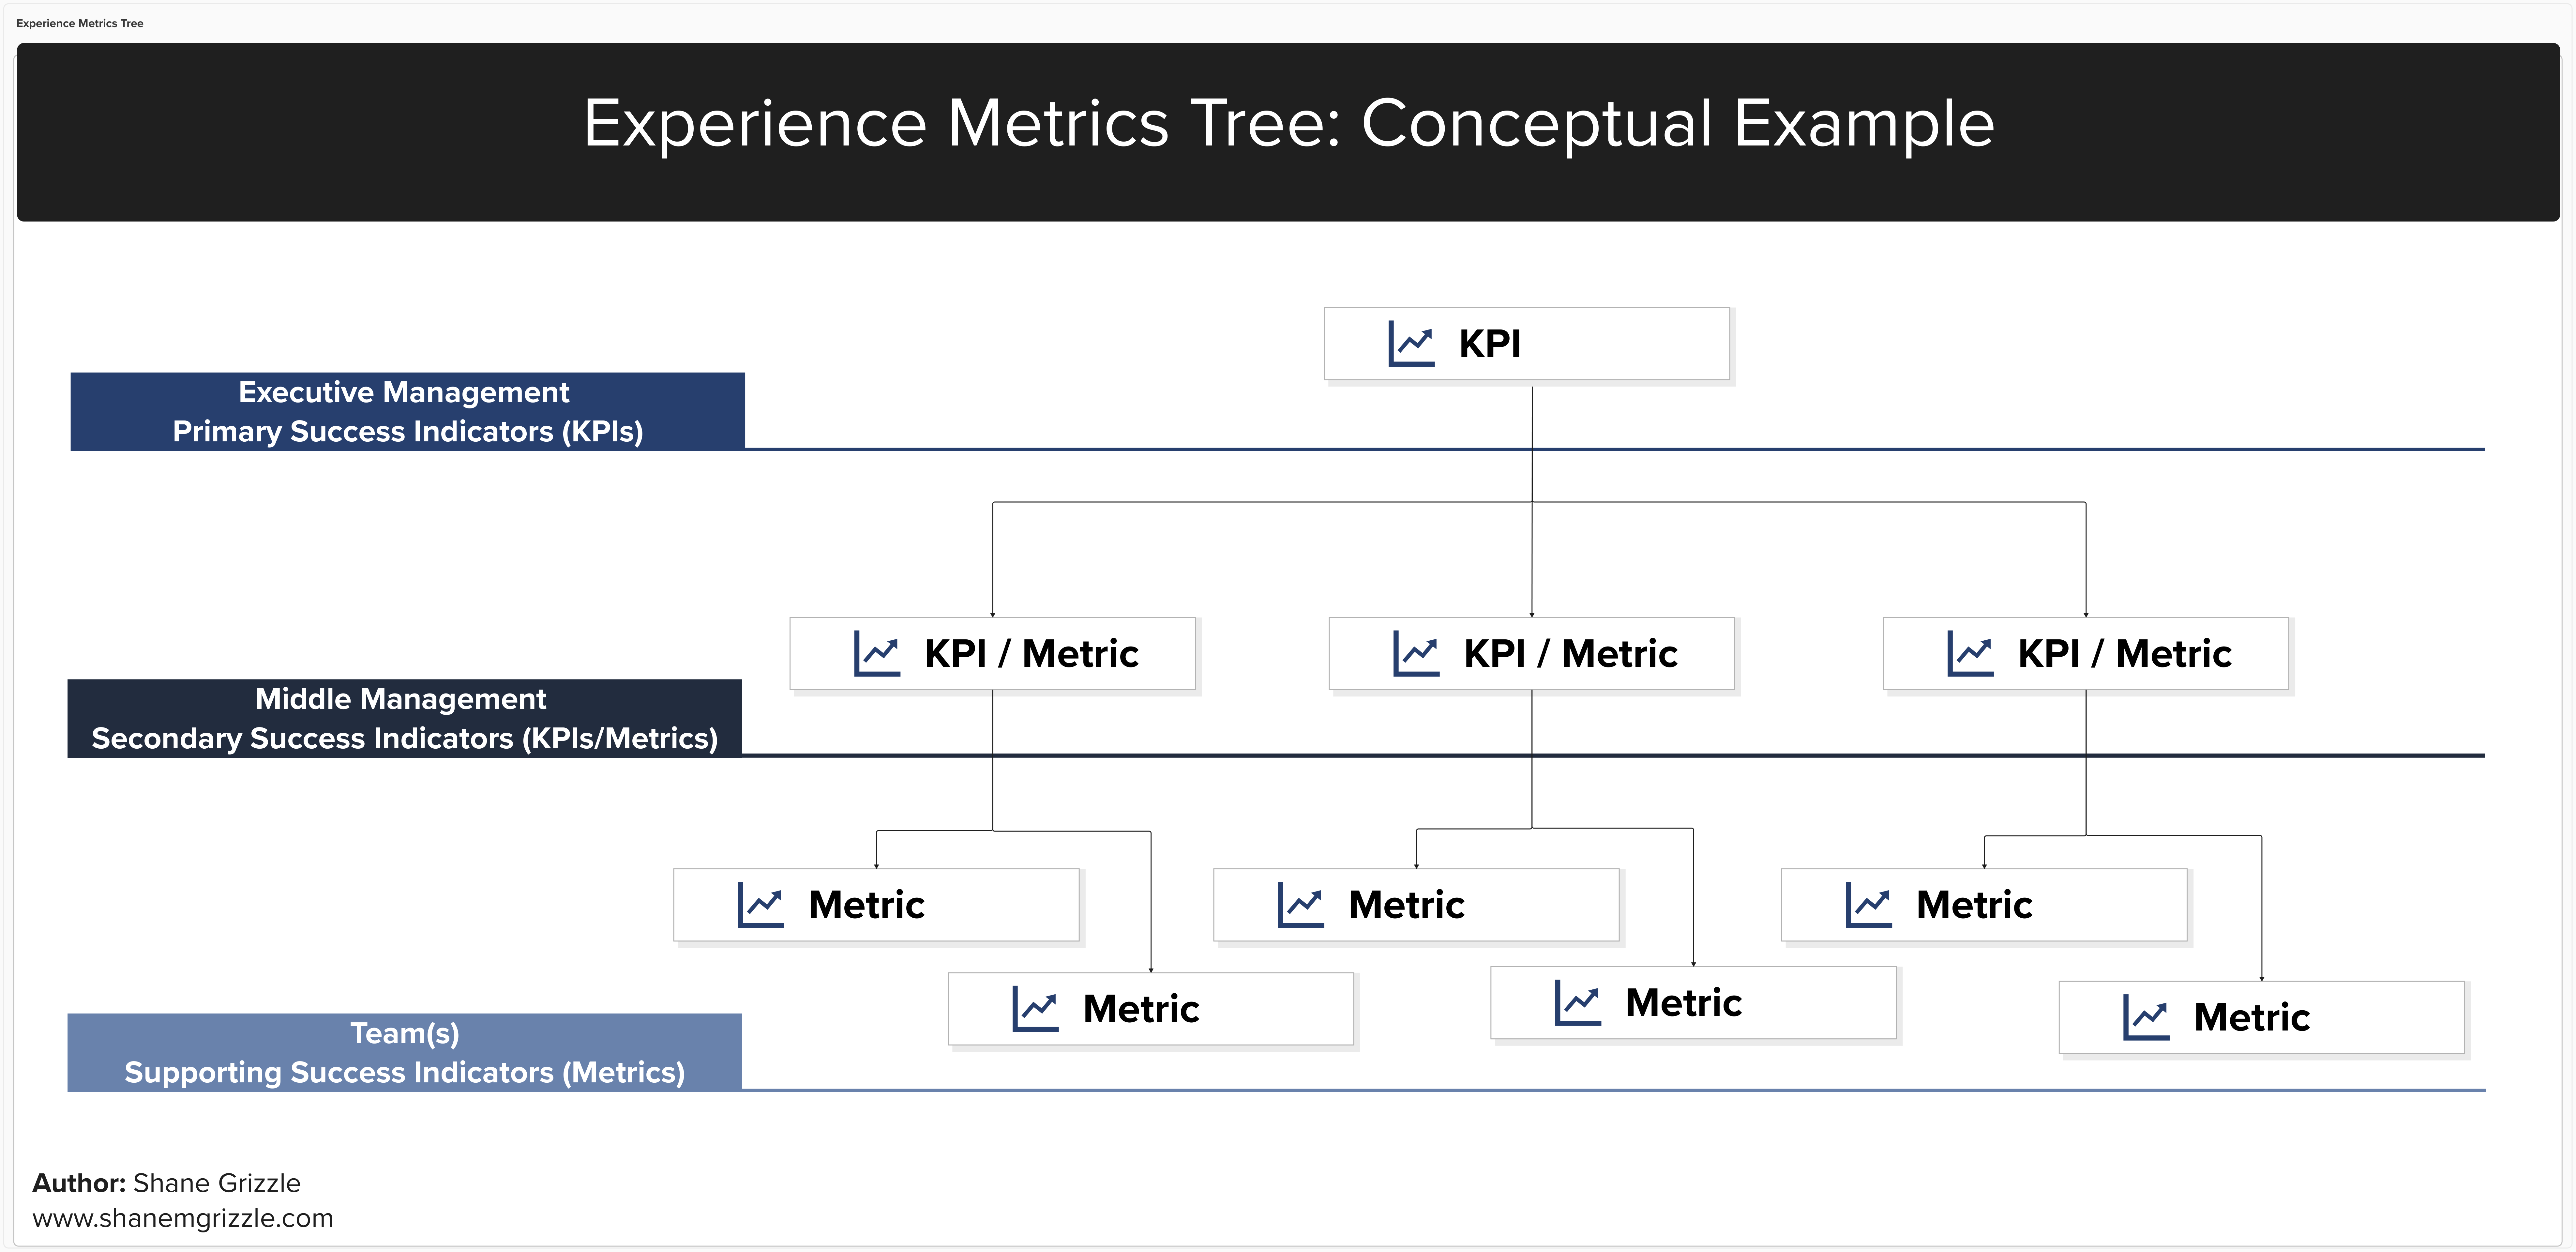
Reference the simplified diagram below that is intended to conceptualize an Experience Metrics Tree, which enables synergy across hierarchical tiers through cascading goals.

It is important to note that Experience Metrics Trees and KPI (Key Performance Indicator) Trees share a conceptual foundation, yet they have distinct focuses and purposes. While a KPI Tree provides a hierarchical structure to monitor and gauge the achievement of organizational, departmental, or project objectives through key performance indicators, an Experience Metrics Tree centers around evaluating different metrics that assess the customer experience, such as usability, engagement, and task success. Both trees are valuable tools that bring together multiple stakeholders and ensure alignment with the broader vision. Also, both trees can complement one another by leveraging Experience Metrics Trees as a component of the overarching KPI Tree.
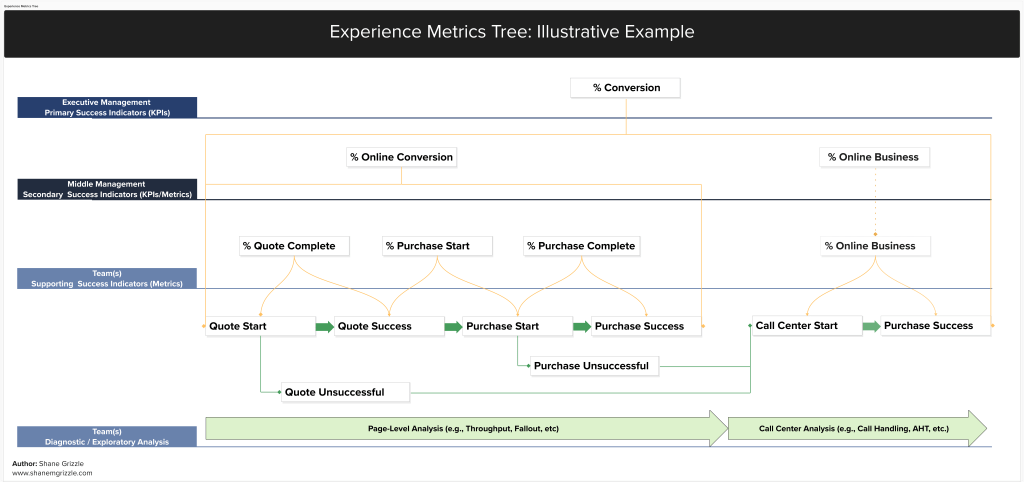
With that said, let’s review an example where an Experience Metrics Tree breaks down task success metrics, which can aid Conversion Funnel Analysis. In this example, the Experience Metrics Tree can aid Conversation Funnel Analysis by providing a structured and visual representation of the various metrics and dimensions associated with the customer journey. The diagram below provides a simplified illustrative example of an acquisition workflow where the customer receives a quote prior to entering another workflow where their purchase is finalized. In some scenarios, the workflow will prevent the customer from continuing, referring them to the Call Center.
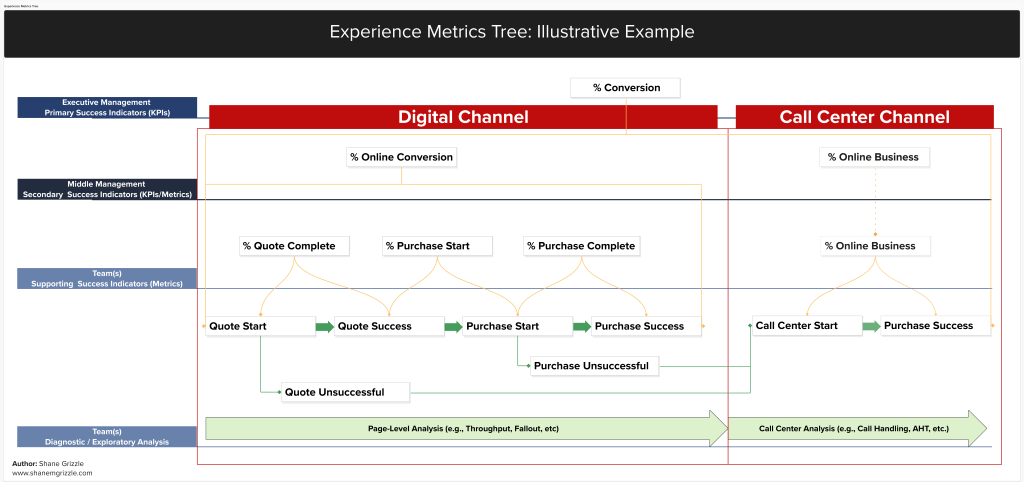
This diagram not only addresses the interconnections between different levels of metrics but also empowers effective storytelling around lower-level activities. Whether engaged in an A/B Test or closely monitoring the post-production release of a new feature, the digital product team finds it effortless to establish the link between their initiatives and the interests of middle and executive management. Moreover, this diagram enables the team to track changes in customer behavior, identifying instances where customers transition from online interactions to seeking assistance from the call center. By embracing cross-channel analysis, this diagram ensures that both digital and call center stakeholders proactively address the holistic customer experience. Reference the following version of the diagram that highlights digital and call center focus areas:
Final Thoughts – Operational Efficiencies
Experience Metrics Trees can significantly enhance operational efficiencies by providing a structured and visual representation of the various metrics and dimensions associated with customer experiences. By mapping out the relationships and dependencies between different touchpoints and interactions, organizations can identify bottlenecks, pain points, and areas for improvement in their workflows. This effort enables them to prioritize resources and investments effectively, streamlining processes and reducing inefficiencies. The hierarchical structure of the Experience Metrics Tree helps teams align their efforts and coordinate actions across departments, fostering collaboration and synergy. However, like mentioned earlier, frameworks and techniques must be leveraged under the appropriate context and may necessitate adaptation in their implementation.
Crafting an exceptional customer experience warrants a comprehensive approach that takes into account various aspects. However, it is crucial to avoid unnecessarily convoluted procedures that transform frameworks and techniques supporting experience enhancements and optimization into cumbersome exercises. Experience Data & Analytics should prioritize agility to adapt effectively to the rapid changes required to meet customer expectations.
Stay tuned for more information about Experience Metrics Trees, specifically how to begin developing them at your organization. For now, start to embrace systems thinking by answering the following:
- How do you define your customer experience?
- What are the parts of the customer experience (e.g., micro experiences, workflows)?
- Are there interconnections and relationships where the parts affect one another?
- How do you cascade goals down to the parts of the experience, accounting for cross-channel activities?

Leave a comment